New Haven Murder Map (2010 – 2019)
Click pin for information about each victim. Pins are color coded by year.
New Haven Murders Per Year (2010 – 2019)
From 2010 to 2019, there were a total of 162 homicides in New Haven.

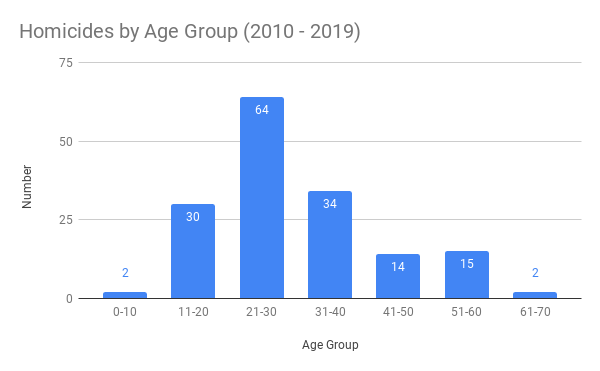
Homicide Victims by Age Groups in New Haven (2010 – 2019)
In 2010, there was a victim who remains unidentified. He was estimated to be between 20 and 30 and is not counted in the graph below.

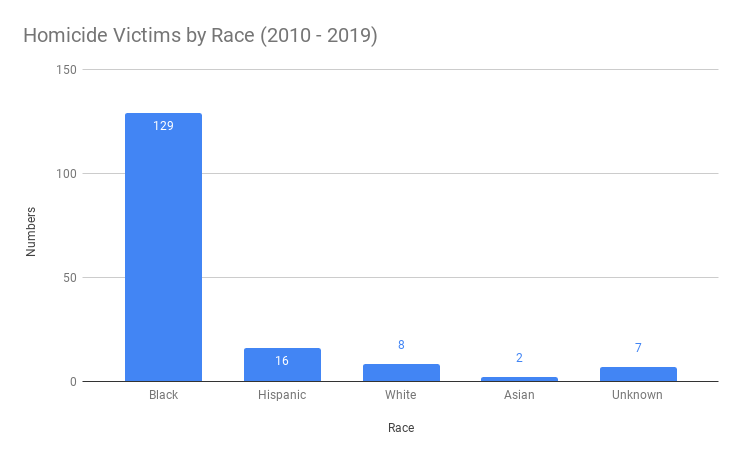
Murder Victims by Race in New Haven (2010 – 2019)
The sole Lebanese victim was counted as white and both Indian victims are counted as Asian.

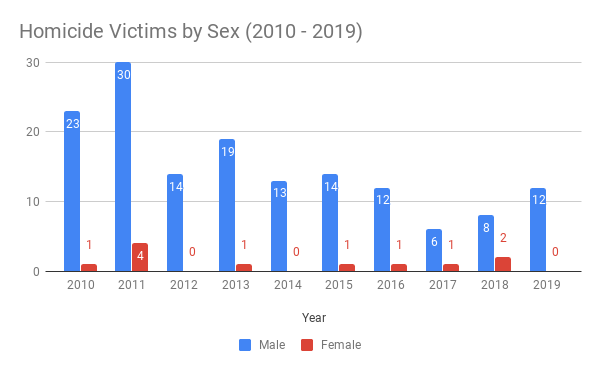
Victims by Sex in New Haven (2010 – 2019)
Between 2010 and 2019, there were 151 male victims versus 11 females. Between 2010 and 2019, men are almost 14 times more likely to be murdered than women.

About the Map:
- Made with Google My Maps
- Credits: New Haven Homicides Report
